
← Health Equity Report Card: Genesee County
Health Outcomes
|
A |
B |
C |
D |
F |
|
No disparity Disparity ratio: 0.0-1.0 |
Little disparity Disparity ratio: 1.1-1.4 |
Disparity may require intervention Disparity ratio: 1.5-1.9 |
Disparity requires intervention Disparity ratio: 2.0-2.4 |
Critical disparity, requires immediate intervention Disparity ratio: ≥ 2.5 |
Disparity Ratio
Disparity can be defined as a significant, unfair difference. Disparity ratios are a measure of the difference in outcomes between two groups. They are calculated by dividing the outcome for one group by the same outcome for a second group. The disparity ratio will always be 1 or greater. The higher the number, the higher the disparity or difference. The resulting number then determines the letter grade for that given indicator. A lack of disparity or difference does not mean adequate health services, access, behaviors, or outcomes.
Report Card by Location
Letter grades indicate the amount of difference between Genesee County and other populations.
No asterisk (*) indicates that other populations face worse outcomes, while those with an asterisk (*) indicate Genesee County faces worse outcomes.
| Indicator | Year(s) | GC x US | GC x MI | GC x Flint |
|---|---|---|---|---|
|
Breast cancer mortality |
US: 2016-20 MI: 2016-20 GC: 2016-20 Flint: 2018-20 |
A |
A |
A |
|
Cancer mortality |
US: 2020 |
A |
A |
A |
|
Cardiovascular disease mortality |
US: 2018-20 |
A |
A |
A |
|
Colorectal cancer mortality |
US: 2019 |
A |
A |
A |
|
Diabetes mortality |
US: 2020 |
F* |
F* |
C* |
|
Heart disease mortality |
US: 2018-20 |
A |
B |
– |
|
High blood pressure mortality |
US: 2018-20 |
A |
A |
– |
|
HIV prevalence |
US: 2019 |
C |
A |
– |
|
Homicides |
US: 2014-20 |
C* |
C* |
– |
|
Homicides by firearm |
US: 2020 |
F |
F |
F |
|
Injury deaths |
US: 2016-20 |
A |
A |
– |
|
Lung cancer mortality |
US: 2016-20 |
A |
A |
– |
|
Preventable heart disease/stroke deaths |
US: 2018-20 |
B* |
A |
– |
|
Prostate cancer mortality |
US: 2016-20 |
A |
A |
– |
|
Stroke mortality |
US: 2018-20 |
A |
A |
– |
|
Unintentional injury mortality |
US: 2020 |
B* |
B* |
A |
|
Years of potential life lost |
US: 2018-20 |
A |
A |
B |
Disparity is present between Flint and Genesee County residents for diabetes mortality, with Genesee County residents facing worse outcomes. This outcome requires intervention. Critical disparity is present between Flint and Genesee County residents for homicides by firearm, with Flint residents facing worse outcomes. This outcome requires immediate intervention. Additional information related to health outcomes is needed for the city of Flint.
Report Card by Race
Letter grades indicate the amount of difference between Black and White populations.
No asterisk (*) indicates the Black population face worse outcomes, while an asterisk (*) indicate the White population faces worse outcomes.
| Indicator | Year(s) | US | MI | GC | Flint |
|---|---|---|---|---|---|
|
Breast cancer mortality |
US: 2020 |
A |
– |
A |
A |
|
Cancer mortality |
US: 2020 |
A |
A |
– |
A |
|
Cardiovascular disease mortality |
US: 2018-20 |
A |
– |
– |
A |
|
Colorectal cancer mortality |
US: 2020 |
A |
A |
– |
A |
|
Diabetes mortality |
US: 2020 |
C |
C |
– |
B |
|
Heart disease mortality |
US: 2020 |
A |
B |
A |
A |
|
High blood pressure mortality |
US: 2018-20 |
B |
– |
B |
– |
|
HIV prevalence |
US: 2019 |
F |
– |
F |
– |
|
Homicides |
US: 2019 |
F |
F |
F |
– |
|
Homicides by firearm |
US: 2020 |
F |
F |
F |
F |
|
Injury deaths |
US: 2020 |
A |
– |
A |
– |
|
Lung cancer mortality |
US: 2019 |
A |
A |
A |
– |
|
Preventable heart disease/stroke deaths |
US: 2018-20 |
B |
– |
B |
– |
|
Prostate cancer mortality |
US: 2019 |
B |
– |
A |
– |
|
Stroke mortality |
US: 2018 |
B |
A |
A |
– |
|
Unintentional injury mortality |
US: 2020 |
A |
B |
B |
A |
|
Years of potential life lost |
US: 2021 |
– |
B |
B* |
B |
Critical racial disparity is present in Genesee County for HIV prevalence, homicides, and homicides by firearm, with the Black population facing worse outcomes. These outcomes require immediate intervention. Critical racial disparity is present in Flint for homicides by firearm, with the Black population facing worse outcomes. This outcome requires immediate intervention. Additional information related to health outcomes is needed for the city of Flint.
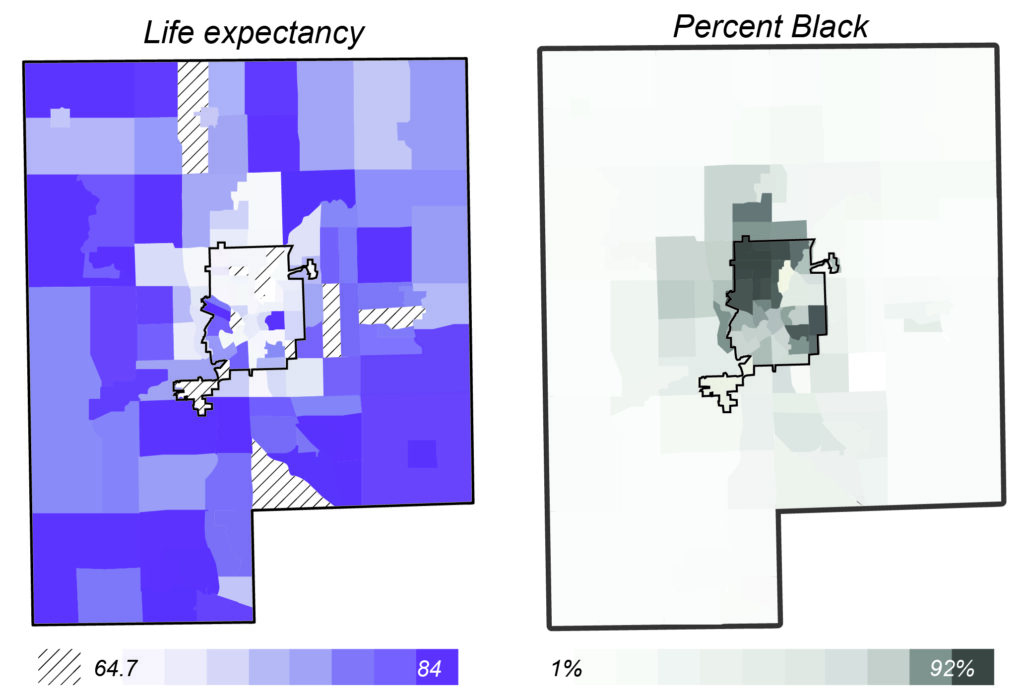
The purple map illustrates life expectancy by census tract among adults in Genesee County. The city of Flint is outlined at the center of the map. The darker the purple color, the higher the life expectancy in the population.
The gray-scale map illustrates the percentage of the population that identifies as Black by census tract in Genesee County. The city of Flint is outlined at the center of the map. The darker the gray color, the higher the percentage of Black individuals in the population.
It’s important to understand the reason for using census tracts as the unit of analysis rather than USPS-derived ZIP codes in the maps above. ZIP code boundaries were drawn to help deliver mail efficiently, not to understand neighborhood demographics. ZIP codes will often include areas within multiple municipalities with different levels of socio-economic distress, which can make it difficult to evaluate certain public health indicators. This is why ZIP codes are less than ideal for understanding neighborhood-level conditions. Census tracts do not cross municipal boundaries and offer a much better alternative to understanding public health metrics at the appropriate scale.
Definitions
Years of potential life lost: Rate of years of potential life lost from all causes of death before age 75.