
← Health Equity Report Card: Genesee County
Socioeconomic Status
|
A |
B |
C |
D |
F |
|
No disparity Disparity ratio: 1.0-1.4 |
Little disparity Disparity ratio: 1.5-1.9 |
Disparity may require intervention Disparity ratio: 2.0-2.4 |
Disparity requires intervention Disparity ratio: 2.5-2.9 |
Critical disparity, requires immediate intervention Disparity ratio: ≥ 3.0 |
Disparity Ratio
Disparity can be defined as a significant, unfair difference. Disparity ratios are a measure of the difference in outcomes between two groups. They are calculated by dividing the outcome for one group by the same outcome for a second group. The disparity ratio will always be 1 or greater. The higher the number, the higher the disparity or difference. The resulting number then determines the letter grade for that given indicator. A lack of disparity or difference does not mean adequate health services, access, behaviors, or outcomes.
Report Card by Location
Letter grades indicate the amount of difference between Genesee County and other populations.
No asterisk (*) indicates that other populations face worse outcomes, while those with an asterisk (*) indicate Genesee County faces worse outcomes.
| Indicator | Year(s) | GC x US | GC x MI | GC x Flint |
|---|---|---|---|---|
|
Bachelor’s degree or higher |
US: 2016-20 |
B* |
A |
B |
|
Median household income |
US: 2020 |
A |
A |
B |
|
No high school diploma/GED |
US: 2016-20 |
A |
A |
B |
|
Poverty |
US: 2016-20 |
A |
A |
C |
|
Employment rate |
US: 2024 |
A |
A |
A |
Overall, individuals in the city of Flint experience worse socioeconomic status indicators compared to individuals living in Genesee County. Specifically, more individuals in Flint are in poverty compared to Genesee County. This indicates a C level disparity that may require intervention.
Report Card by Race
Letter grades indicate the amount of difference between Black and White populations.
No asterisk (*) indicates the Black population face worse outcomes, while an asterisk (*) indicate the White population faces worse outcomes.
| Indicator | Year(s) | US | MI | GC | Flint |
|---|---|---|---|---|---|
|
Bachelor’s degree or higher |
US: 2011-21 |
B |
B |
B |
B |
|
Median household income |
US: 2021 |
B |
B |
B |
A |
|
No high school diploma/GED |
US: 2018-19 |
B |
B |
B |
A |
|
Poverty |
US: 2021 |
C |
D |
C |
A |
|
Employment rate |
US: 2022 |
A |
A |
– |
– |
Racial disparity is present in Genesee County for Bachelor’s degree or higher, median household income, and no high school diploma/GED, with the Black population facing worse outcomes. These outcomes should be closely monitored and may require intervention. Racial disparity is present in Genesee County for poverty, with the Black population facing worse outcomes. This outcome may require intervention. Racial disparity is present in Flint for Bachelor’s degree or higher, with the Black population facing worse outcomes. This outcome should be monitored and may require intervention.
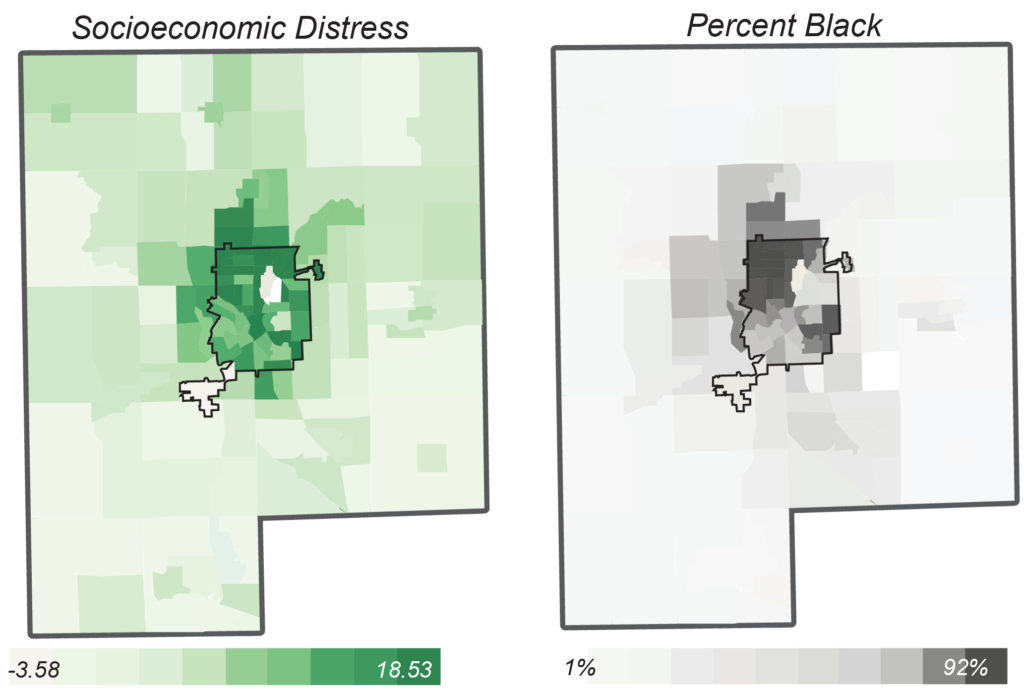
The green map illustrates socioeconomic distress by census tract among adults in Genesee County. The city of Flint is outlined at the center of the map. The darker the green color, the higher the socioeconomic distress in the population.
The gray-scale map illustrates the percentage of the population that identifies as Black by census tract in Genesee County. The city of Flint is outlined at the center of the map. The darker the gray color, the higher the percentage of Black individuals in the population.
It’s important to understand the reason for using census tracts as the unit of analysis rather than USPS-derived ZIP codes in the maps above. ZIP code boundaries were drawn to help deliver mail efficiently, not to understand neighborhood demographics. ZIP codes will often include areas within multiple municipalities with different levels of socio-economic distress, which can make it difficult to evaluate certain public health indicators. This is why ZIP codes are less than ideal for understanding neighborhood-level conditions. Census tracts do not cross municipal boundaries and offer a much better alternative to understanding public health metrics at the appropriate scale.
Definitions
Median household income: Income where half of the households in an area earn more and half of the households earn less.
Socioeconomic distress: A census block group-level continuous variable referring to the amount of material and social deprivation (lone parenthood, poverty, low educational attainment, and unemployment combined into one score), in which higher numbers mean higher distress.