
The Health Equity Report Cards (HERCs) support the health and well-being of Michigan residents by providing understandable, relevant, and actionable health outcome data. By understanding the current state of health disparities (differences) and health outcomes in our communities, we can better address their causes and support prevention efforts. This will help us all live in a healthier community and create better lives for generations to come. The information presented in the HERC is only part of our community’s story. It does not include the tremendous efforts by community organizations, residents or others to meet community needs.
Health Equity Report Cards
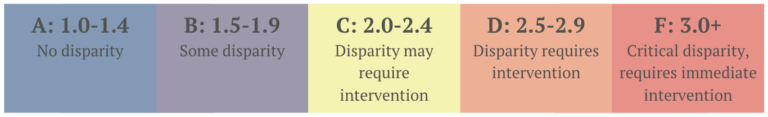
To understand the differences for each indicator, we calculated a disparity ratio. This tells us how small (good) or large (bad) the differences are for each indicator. A letter grade is then given for each disparity (difference). Importantly, we must keep in mind that little to no disparity (difference) – an A or B grade – does not mean adequate health services, access, behaviors, or outcomes. It simply means there isn’t a large difference between race or geographic locations for this health indicator.
Please contact Dr. Heatherlun Uphold or fill out a feedback survey (linked within each HERC) if you have any questions or feedback.